- 01 The problem
- 02 My role
- 03 Context
- 04 Discovery
- 05 Key decisions
- 06 The system
- 07 The impact
- 08 What I learned
An implant inside the heart, and an app patients couldn't read.
Vectorious patients live with a sensor implanted in their heart that measures pressure every day. But the app that came with it spoke the language of doctors. Patients couldn't understand their prescriptions, see when their doctor had changed them, tell when a measurement had failed, or know when a questionnaire was waiting for them.
The cost landed on everyone: confused patients, constant phone calls, extra clinic visits, and cardiologists buried in data.
The only in-house designer, across every surface.
I owned the design of the patient app, the cardiologist dashboard and the design system that connects them. I led a team of freelance designers, and worked closely with product, the clinical team, engineering and regulatory, in a product where every screen had to meet medical standards.
Two audiences, one sensor.
Patients aged 40 to 80, at home, needed to know simply how they were doing and what to take today. Cardiologists needed to monitor many patients remotely and know exactly who needed them. To design for both, I ran research across 10 countries and 110 clinical sites: field observation, in-depth interviews, and usability testing with real patients.
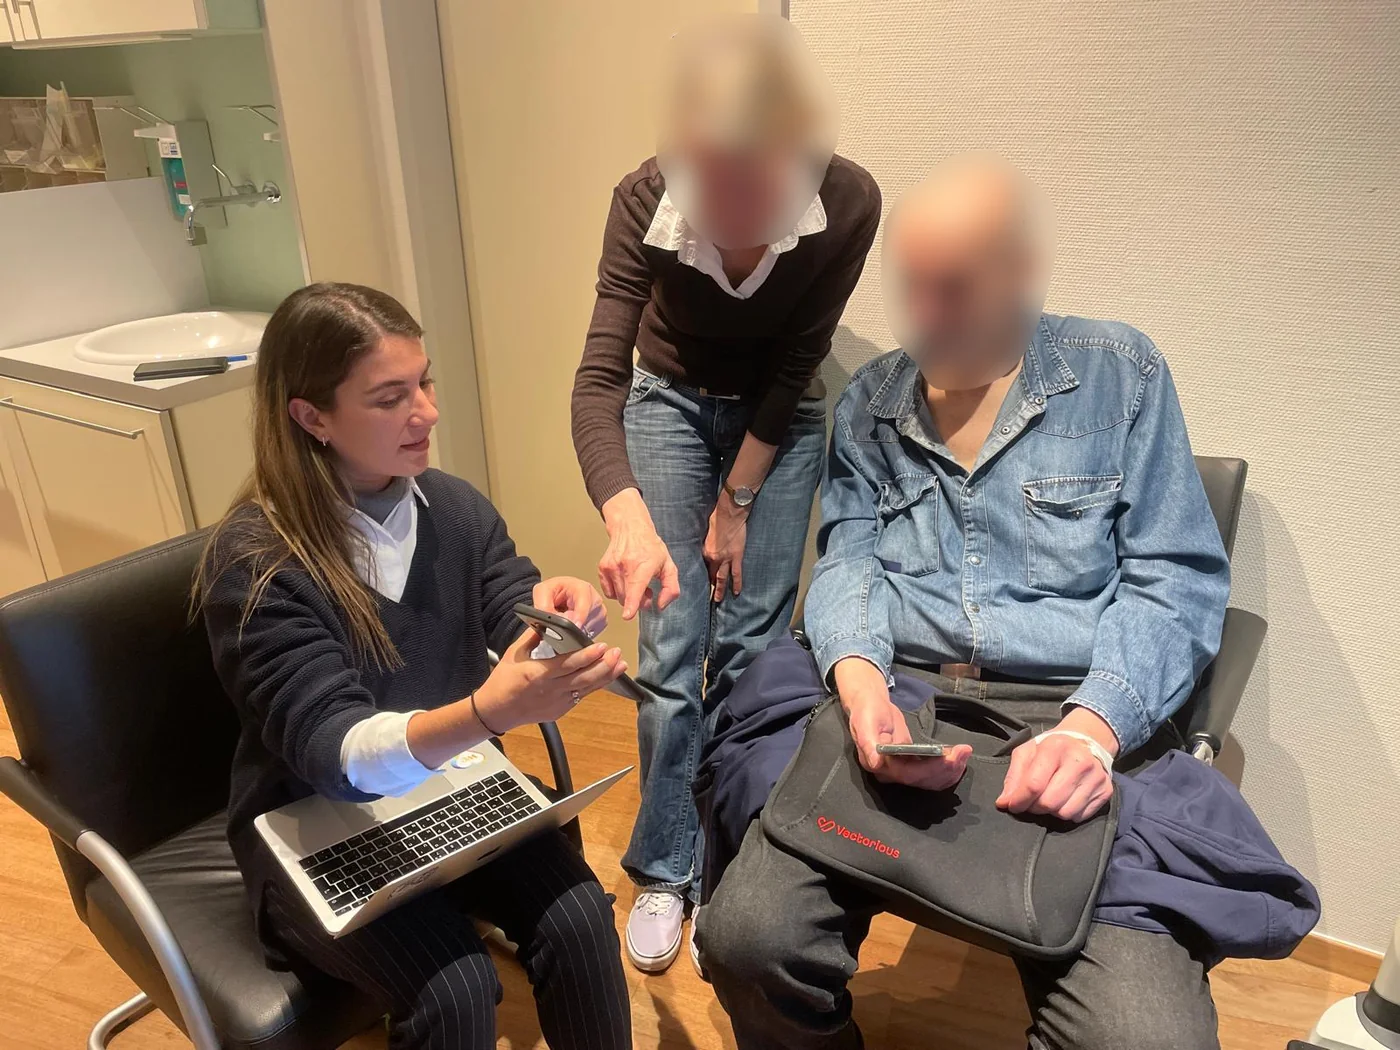
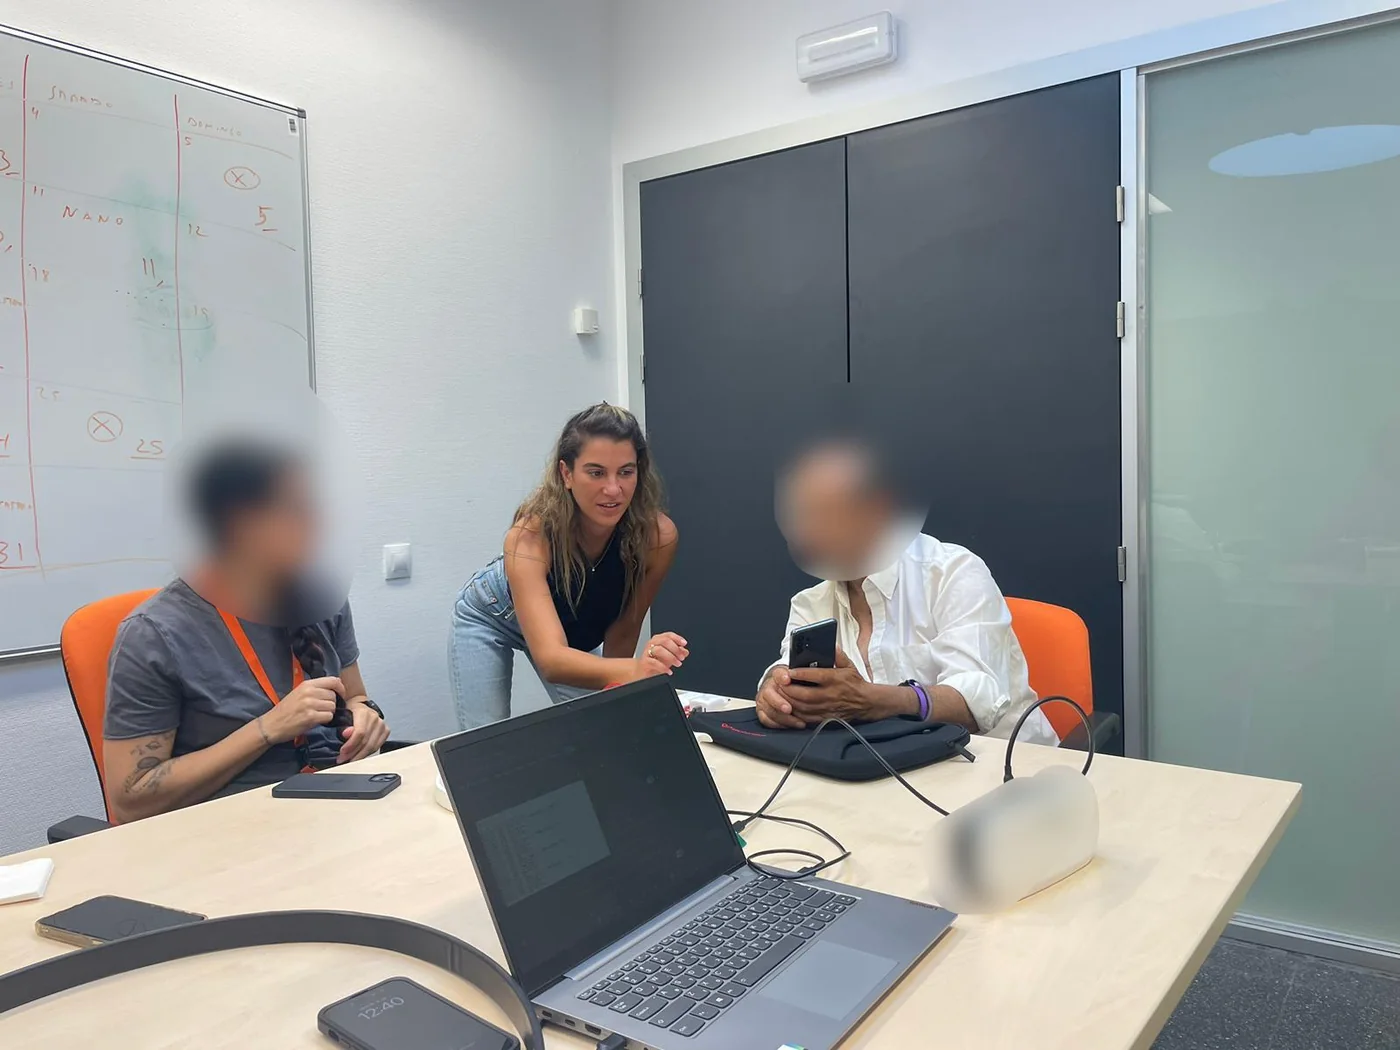
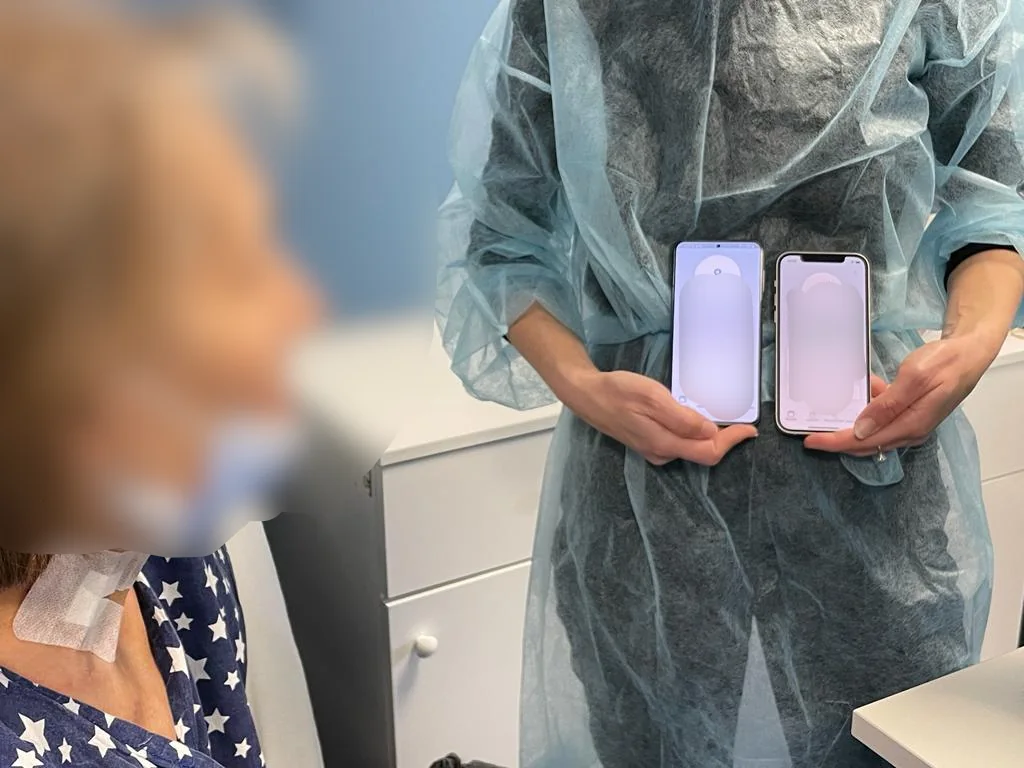
In the field: usability testing with patients and clinicians. Faces blurred for privacy.
Patients weren't using the app alone.
In the field, I saw something no interview had told us: many patients handed their phone to a younger family member to help with the technology. The app had been designed for one user, but the real user was often two. Together with our product manager, we decided to create a second app, Caregiver, for patients' family members, which I designed and planned.
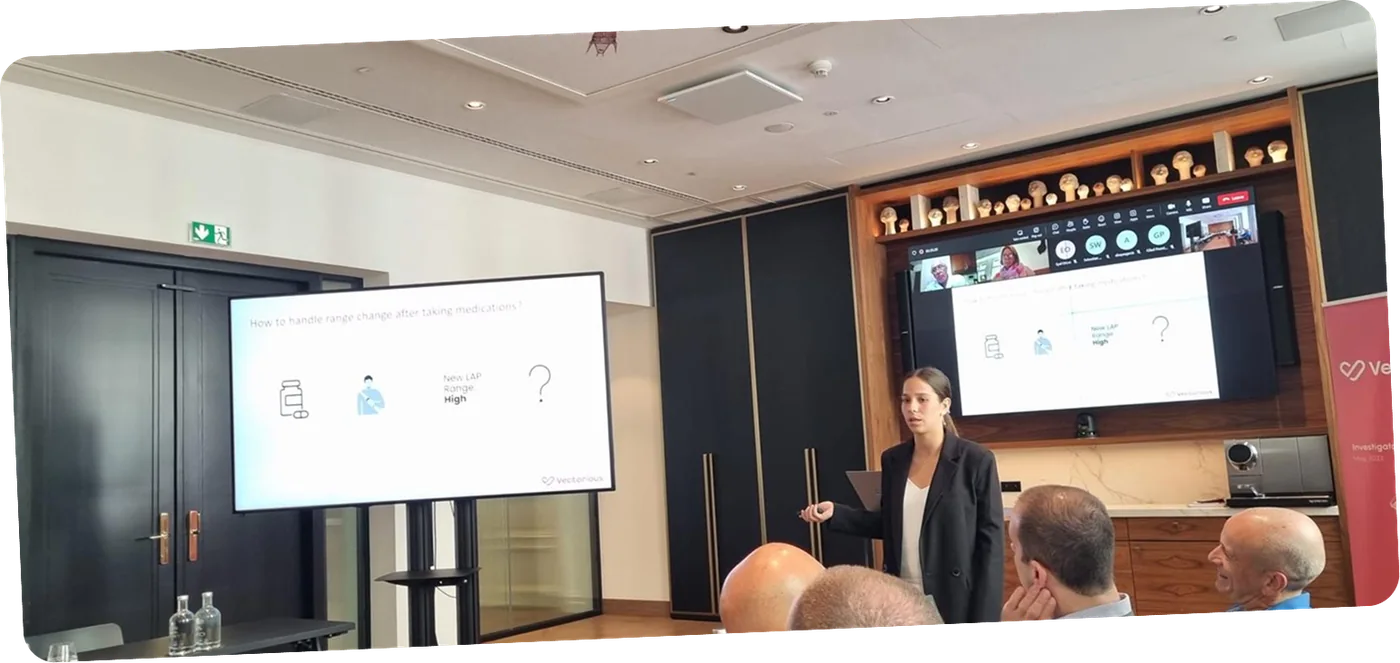
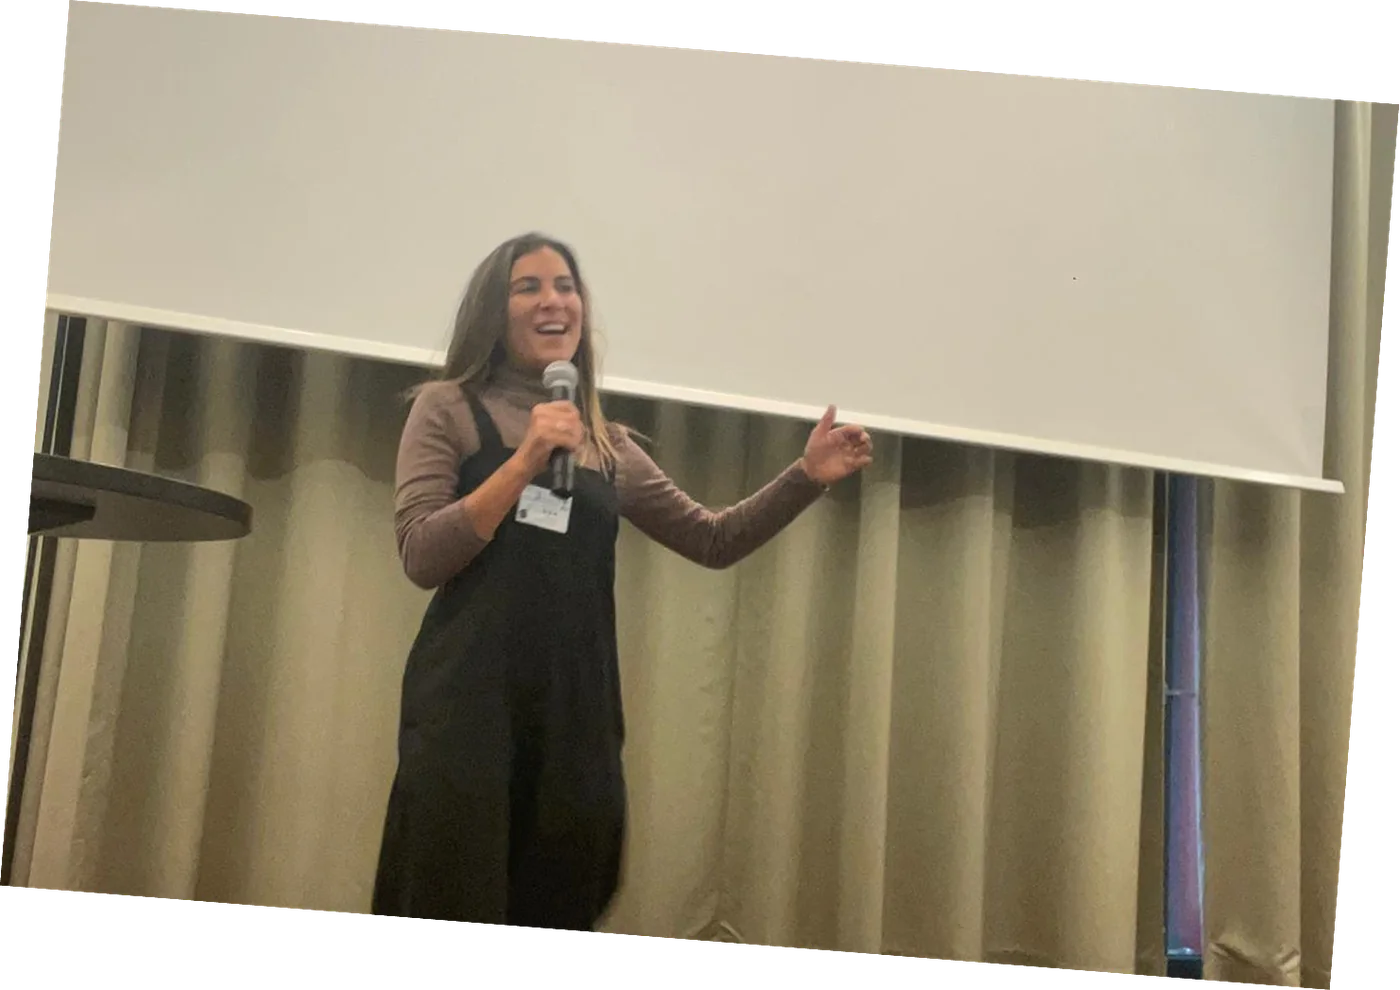
Sharing what we learned with clinicians, investigators and the team.
Making a medical device feel safe, for patients and for doctors.
- 01
Everyday language instead of medical terms.
"LAP range" became "My Status". A small change in words made a big change in understanding.
- 02
Status you can read at a glance.
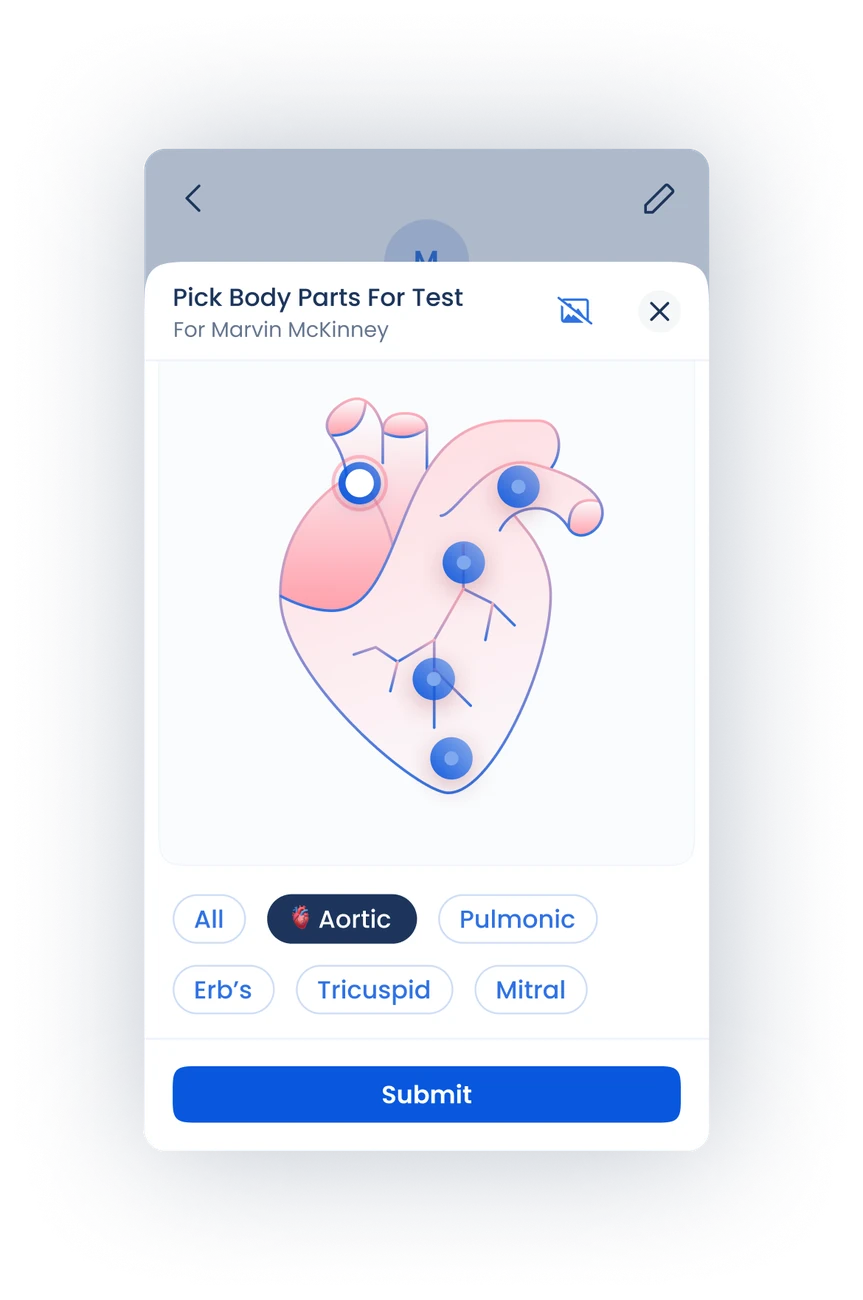
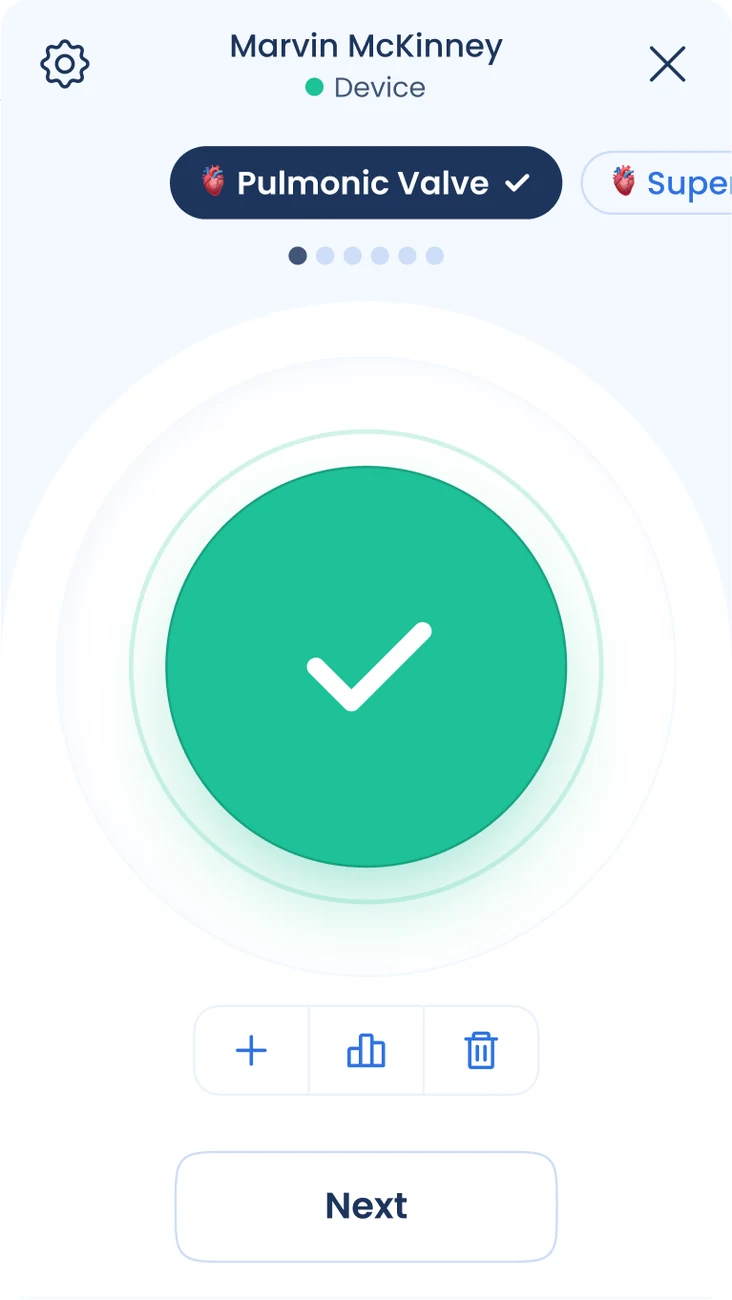
A four-color system, Today and Yesterday tabs, and one clear action per screen show patients what to take and whether their measurement worked.
- 03
Trust and psychological safety.
This is an implant inside the heart. Every message was designed to feel calm and clear, never alarming, while staying clinically accurate.
- 04
Doctors see who needs them, not every number.
For the first time, the dashboard monitors patients in real time and flags only those whose measurements are out of range, so cardiologists can act on the patients who need a change in treatment. Doctors needed to trust the measurements enough to care for patients from the dashboard alone.
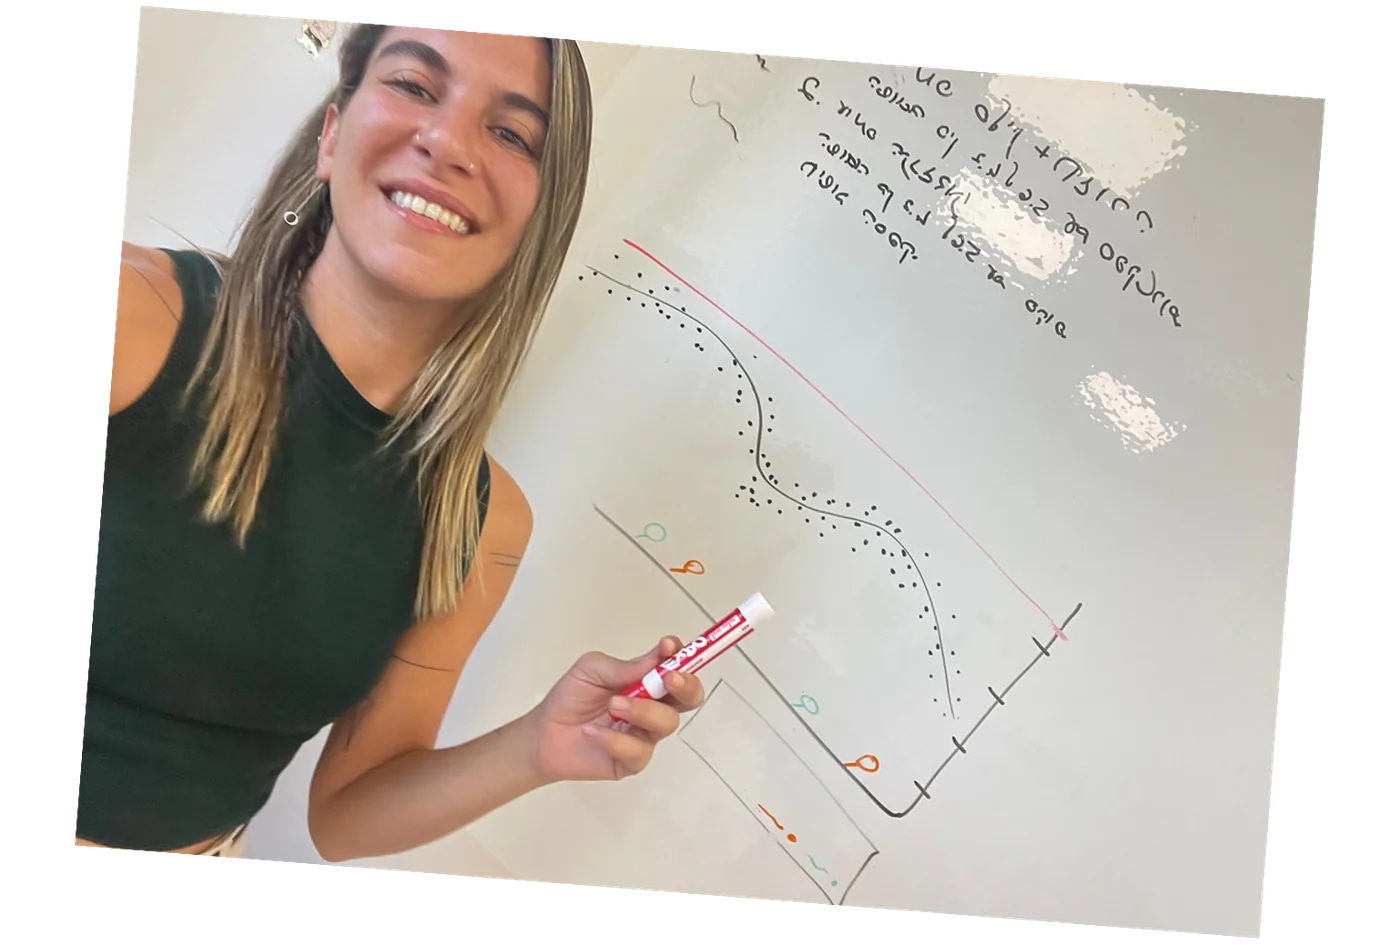
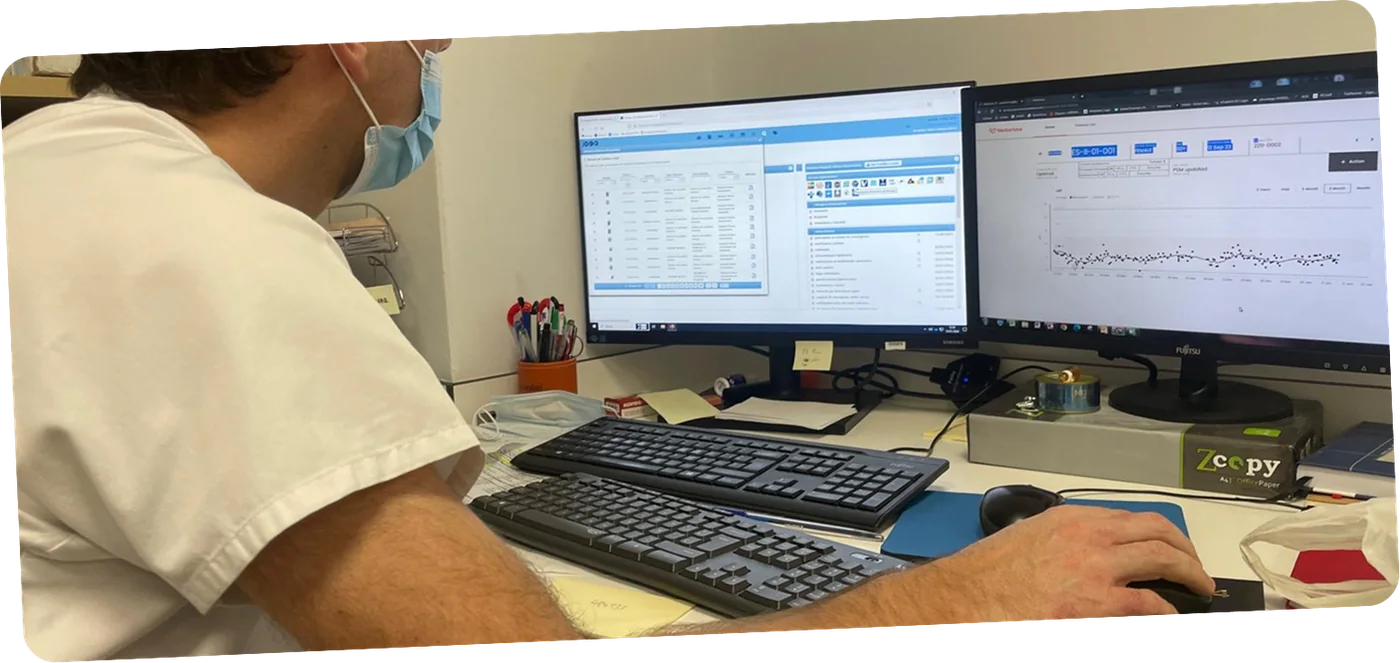
From a whiteboard sketch of the pressure graph to the dashboard in a cardiologist's daily work.
One design language for patients and doctors.
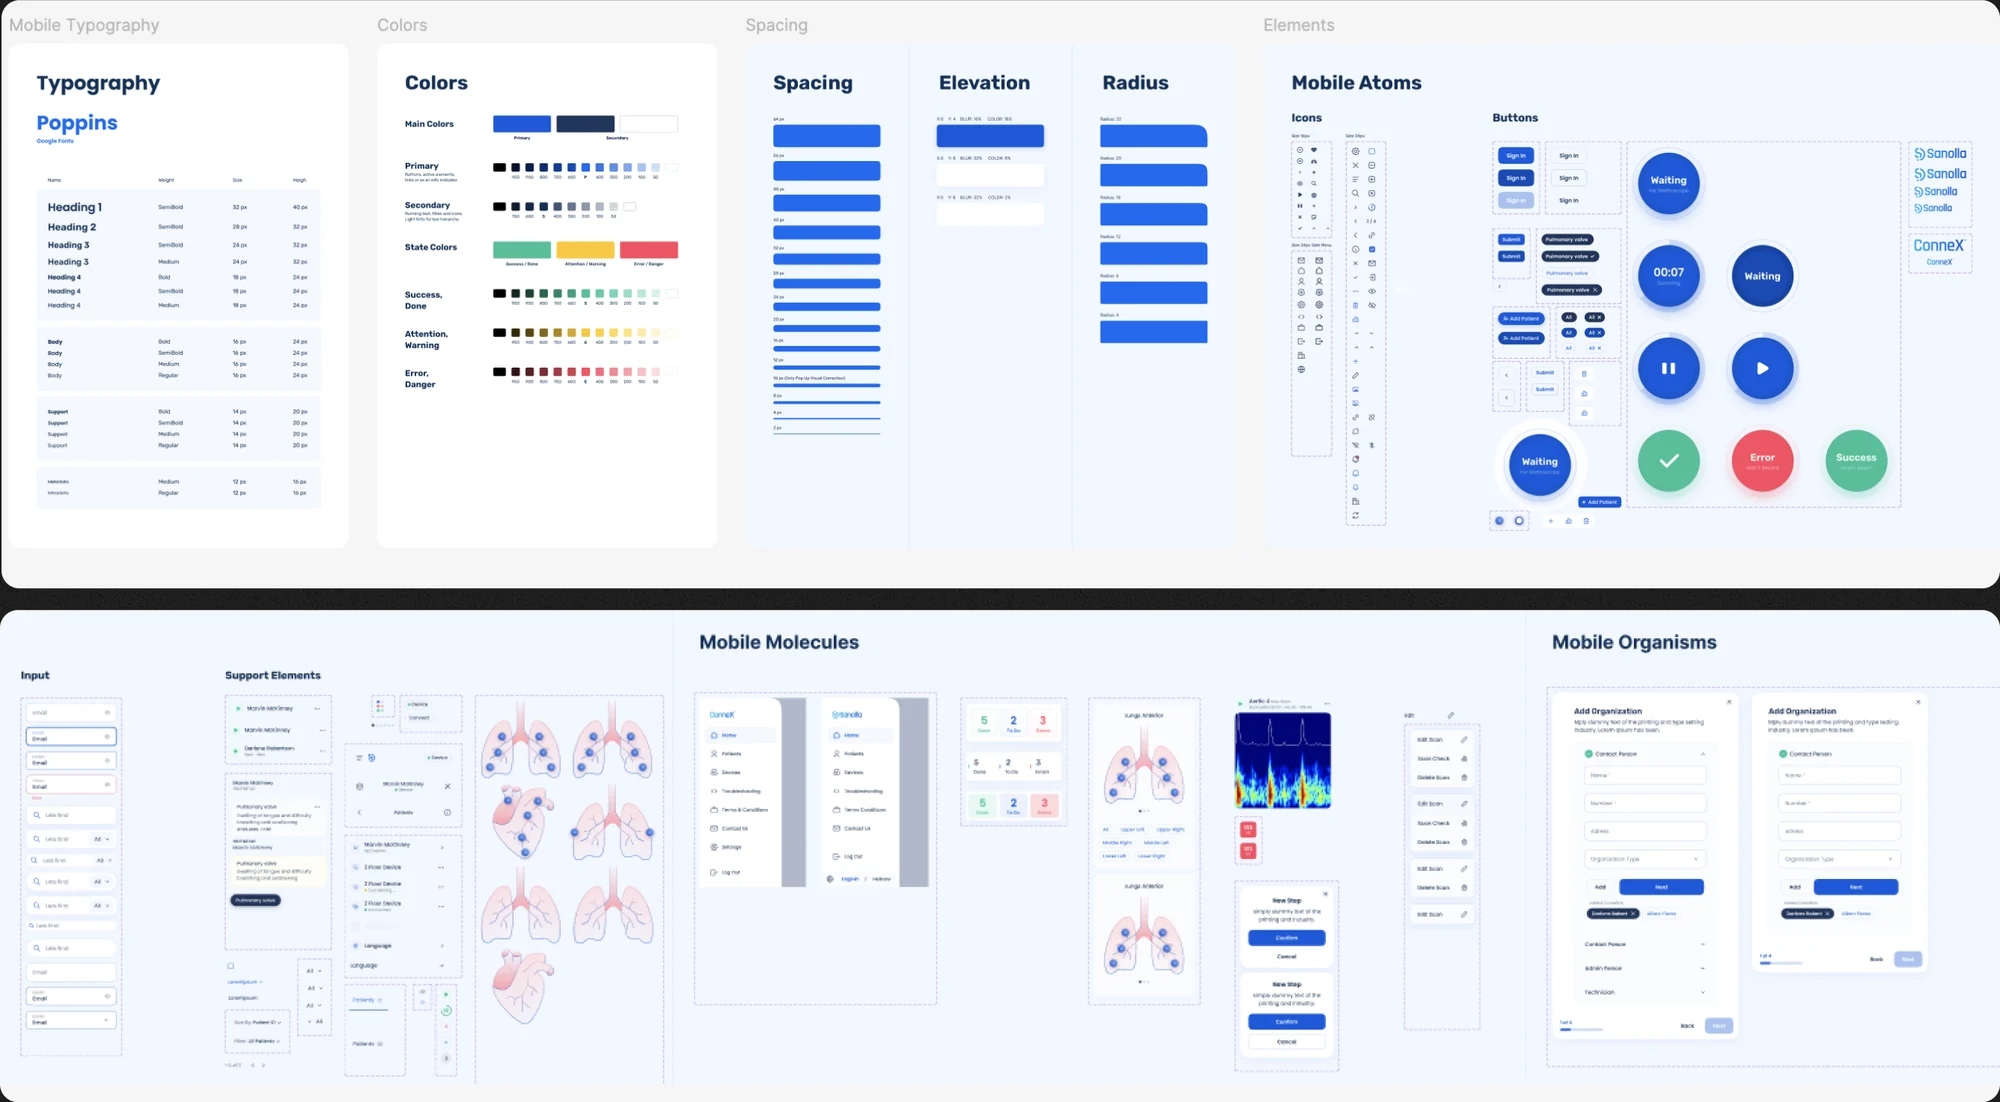
I designed and implemented a design system on my own, covering typography, color, spacing and components from atoms to full flows. It was adopted by every team in the company, so the patient app and the cardiologist dashboard finally spoke the same visual language. I also set up the company's first analytics framework, so design decisions could be measured.
Patients understood their care, and doctors got their time back.
Patients could finally understand their prescriptions, measurements were completed successfully, and questionnaires went straight to their doctors. That saved many phone calls and hours at the clinic, and cardiologists' workload dropped significantly. Patients reported a better quality of life over time.
The redesigned app reached a 95% user success rate, and the platform was part of the product when Vectorious was acquired for $497M.
Keep the human heart in the system.
When a product can affect someone's health, you have to be extra careful. That means deep research, attention to the smallest details, and above all remembering the person on the other side of the screen. Working on Vectorious, I often felt like the human heart inside a complex, technical system.